Monday 31 December 2018

Power BI - Introducing dataflows

Case
Power BI recently introduced dataflows. What is it and who should use it?
Power BI dataflows


Solution
According to Microsoft this new addition is for self-service ETL by business annalists and BI professionals. A minor addition from our side: especially business annalists that are skilled with tools like Excel and BI professionals with already a focus on Power BI will probably be very exiting using this new addition. An other group that could benefit of this new feature is the technical application administrator that has a great amount of knowledge of the data model of their application. With dataflows the could do some data preparation for the business annalists

First of all you must have at least a Power BI Pro license and this new preview feature is a Power BI Service-only feature that is not (yet?) available in Power BI Desktop. However you can use the result of a Data Flow which we will show you in the last step.

1) Power BI Service
To create a dataflow, sign in to Power BI Service and go to one of your workspaces, but not My Workspace. Or create a new workspace. Here you will find a new tab called "Dataflows (preview)" and in the Create-menu there is a dataflow option. Click on it to create a new dataflow.

Power BI dataflows - Create new dataflow


2) Add new entities
In this step we will add a source for our dataflow. You can map this data to one of the standard Common Data Model (CDM) entities, but you can also create 'custom' entities that are not mapped. The CDM is a standard model for example for contacts or accounts to which you can map your sources like CRM or SalesForce. It should make it easier for development, but also analytics. In a subsequent post we will explain the CDM.

For this example we will not map to CDM, but create a 'custom' entity. We will use a text file that contains sensor data. We use Azure Blob Storage to store this data, but of course you can also use an internal file share. However then you first need to install the On-premises data gateway.


As told, we choose "Azure Blobs" as data source and next fill in the connection settings. If you have ever used this storage account before then it will remember the account key. Choose your Blob folder which contains the data and now you can transform your data similar to the Power Query Editor in Power BI Desktop.

Power BI dataflows - Create new Entity


3) Edit Query
Just like Power BI Desktop you can do data preparation inside an "Edit Query" mode. This Power Query version does not have the full functionality compared to Power BI Desktop, but the expectation is that it will be extended in the upcoming releases. Some limitations of the current Query Editor in dataflows are: you cannot change the datatypes of the columns or use the 'Group By' function.

Power BI dataflows - Power Query Editor


There are also differences between a Pro license and Premium. In case you are doing some basic transformations like combining two queries (using Merge or Append queries) it will cause the following warning when using a Pro license:
This dataflow contains computed entities, which require Premium to refresh. To enable refresh, upgrade this workspace to Premium capacity.

Power BI dataflows - Pro license vs Premium


More information about the differences between a Pro license and Premium here.

4) Save and use dataflow 
After finishing the data preparation, you must save the new dataflow. Give it a suitable name and after saving, you will be asked to refresh the dataflow or schedule it later. You can set up a "Scheduled refresh" the same way as a dataset.

Power BI dataflow - Save (and schedule refresh)


Open Power BI Desktop, select "Get Data" and now you can use a Dataflow as a source for your report.

Power BI Desktop - Use a dataflow as source


Conclusion
In this post we created our first dataflow, a new (preview) feature of Power BI. Despite we are using the first version which is still lacking of some basic features, it already looks very promising. We expect/hope that the limited Power Query possibilities will soon be aligned with those in Power BI Desktop making this a very powerful tool.

The main benefit of this new addition, is that you don’t have to setup and host a separate ETL tool with possibly complex code. Now everything is integrated in one platform. The disadvantages are, besides the limited Power Query options, the lack of versioning and release management.

Will it replace enterprise ETL with tools like SSIS, Azure Data Factory and Azure Databricks? Probably not in the near future. For now it is still self-service ETL which you could use as a first step to enterprise ETL. However, Microsoft will likely extend this tool in the coming years. Just like they did with Power BI itself. Back in 2014 most people didn’t see that as a serious alternative for reporting.

An alternative route map could be integrating Power BI dataflows within your existing BI platform. You can publish (and refresh) the result of your dataflows to Azure Data Lake and then pick up the data, besides Power BI, with tools as Azure Databricks and Azure Data Factory. We will explain this in a subsequent post next year.

Monday 12 November 2018

Power Apps: Add Microsoft Flow to delete records

Case
In a previous post you wrote that Microsoft Flow could help to delete records with my PowerApps. How do you add a Flow to PowerApps?
PowerApps ♥ Flow


Solution
To add a new Flow to PowerApps we have two options. First could go to Microsoft Flow and create a new Flow that starts with a 'PowerApps button' trigger and then go to PowerApps and use the new Flow (see step 7). The second option is to start from PowerApps and then use the menu to create a new Flow. For this example we will start from PowerApps.

The starting position is a table called Job with a primary key called JobId for which we have generated a PowerApps app. We will replace the code of the delete button to use a Flow instead.

1) Create new Flow
Edit your PowerApps app and go to the Action menu and click on Flows. A new pane will appear where you can edit existing Flows for PowerApps or you could create a new one from scratch. Click on 'Create a new flow'. This will open a new tab with Microsoft Flow.
Create new Flow


2) Rename Flow
It's important to rename the Flow before you save it otherwise the old default name will show in PowerApps. You can do this by clicking on the text 'PowerApps button' on the top left side op the Flow editor: 'DeleteJob'. A suitable descriptive name will also make it easier to find your Flow and will make your code more readable. You could also include the name of your PowerApps app. This will make it easier to understand the purpose of your Flow in case you have a whole bunch of them.
Rename Flow


3) New Step - SQL Server - Delete Row
Next step is the actual deleting part. Since our source is an Azure SQL Server Database we first search for 'SQL Server' and then choose 'Delete row'. If you already have database connections (like the ones in PowerApps) then you can reuse them. Click on the three dotes menu to change the connection.
Delete Row


Note: If you want to delete multiple records then you should use 'Execute a SQL query' or 'Execute stored procedure'. For this example we will only delete one row at a time.

4) Rename Step
Now first rename the SQL action. This will give the parameters in the next step better names. Again, click on the three dotes menu to change the name of the action: SQL Delete Job.
Rename SQL Action


5) Step Parameters
In the Table name property select the name of the table in which you want to delete records. In the Row id property we will add a parameter that will ask PowerApps for the value of the primary key column. If you click on the textbox you can add an expression. Go to the Dynamic content tab and click on 'See more' in the PowerApps row. This will show the option 'Ask in PowerApps'. Select it and you will see the new expression in the textbox.
Parameters


6) Save and Close
Now we are done with the Flow. Click on the save button and then close the tab to return to PowerApps editor. The list of existing Flows will now automatically show the newly created Flow.
Save and close


7) Use new Flow in PowerApps
Select the icon or button where you want to execute the Flow and then add the code: [NameOfYourFlow].Run([PrimaryKeyValue])

Is should look something like this. The Back() returns to the previous screen.
DeleteJob.Run(BrowseGallery1.Selected.JobId)
Add flow to icon


You could also add Back() to return to the previous screen:
DeleteJob.Run(BrowseGallery1.Selected.JobId);Back()
8) The result
Now it is time to test the newly added delete icon/button.
The generated app with the new delete icon


Conclusion
This post showed you how to add a Microsoft Flow to delete records within you PowerApps. This is especially useful in case you have more than 500 records in your table. The steps are fairly simple, but please keep in mind to use good descriptive names for the Flow and the steps within the Flow. This will make the code in the PowerApps more readable.


Wednesday 31 October 2018

Power Apps Snack: RemoveIf not deleting all records

Case
I my PowerApp I want to delete records in a table with RemoveIf, but it doesn't remove all records selected with the condition parameter.
Remove record(s) in PowerApps


Solution
This problem occurs when the source table has more than 500 records. Because RemoveIf is a non-deligated function it will not deligate the delete instruction to the source. Instead it will first get 500 records (that number can be changed) and then delete only within these 500 records.

There are two solutions:

1) Change Data row limit for non-delegable queries
One option is to change that magic 500 number to for example 1000. You can do this in the App Settings under Advanced settings, but there is one caveat when changing that. It could cause performance issues because it will then first 'download' the 1000 records before it will start deleting.
And what if you have tens of thousands of records or even millions? That is not something you want to 'download' to your app! So be careful with this magic number.
Data row limit for non-delegable queries


2) Use Microsoft Flow
An alternative is to use Microsoft Flow to delete records in large tables. You can create a new Action for your button that executes a Microsoft Flow that does the deletion via a Stored Procedure or query.
Adding Microsoft Flow to your PowerApps


There is of course a little downside. The free edition of Flow only allows 750 runs per month and the Office 365 only 2000 runs per month. Above these numbers you need Flow Plan 1 or 2 with 4500 and 15000 runs per month. Or you can buy an additional 50000 runs per month for USD $40.00. If you are sure you don't need these high numbers then you have a good, free alternative.


Conclusion
This post showed you two alternative solutions both with their own pros and cons. There is a third alternative which I haven't tested yet and that is to create a custom connector. Or you could just add a PowerApps Idea to suggest Microsoft to solve this and post the URL in the comments below.

Power BI Snack: Introducing Data Profiling

Case
When data is not extracted from a cleaned up or validated environment, such as a Data Warehouse or Data Mart, the first step is to analyse and possible clean up the data. How can Power BI help in this?

Data Profiling in Power Query Editor


Solution
The release of October 2018 Desktop update introduced a new (preview) feature that can profiling the data in the Power Query Editor. With this, you can do some quick analysis over your data and you can easily identify errors and empty values in a column.

For this blog post we use sample data from WideWorldImporters. We have saved the data in a CSV file, because it is more common to do this kind of analyses when you load raw data from Text or CSV files into your Power BI Model instead of using validated data from a star schema in a Data Mart.

Apply data profiling in Power BI
Because it is a preview feature, we have to turn this feature on. Go to "File - Options and settings - Options - Preview features" and select Enable column profiling.

Power BI Desktop - Enable Preview feature


Open the Power Query Editor and load your data. In our case it is a CSV file that contains raw data about sales orders. Go to the "View" tab and select Column quality. With this option you can see whether your data contains errors or empty values, also known as "null" values.

Power BI Desktop - Column quality in Power Query Editor


Besides this, you can also view the total of unique and distinct values. Go to the "View" tab and select Column distribution. Unique values indicates how many values occur only once and distinct values means how many different values there are in the specific column. Now the Query Editor will also recommend to do a quick fix if you want, for example remove the duplicate values in a column.

Power BI Desktop - Column distribution in Power Query Editor


Note:
Be aware of the fact that column profiling is only based on top 1000 rows (preview results of the query).

Conclusion
In this post you saw a new feature called "Data Profiling". It is a good start and useful to use this for doing some quick analyses over your data. Note that this feature is in preview.

The program team of Power BI has announced to add more capabilities for data profiling, so we are very curious about what this will bring even more in the future.

Saturday 29 September 2018

SSRS Snack: Download all SSRS reports

Case
I want to download all my SSRS reports (and data sources) from my Reporting server, but not manually. Is there a solution?
My Reporting Server


Solution
The easiest way to do this is with some PowerShell scripting and the SSRS webservice. The following PowerShell script recreates the SSRS folder structure on a local drive and downloads all reports (*.rdl) and all data sources (*.rds) to the corresponding folders.

Note 1: you need full access if you want to download everything
Note 2: empty folders are not recreated locally
Note 3: It only works for SSRS 2012 and higher (webservice differs for older versions)


1) PowerShell ISE
Open PowerShell ISE and copy and paste the code below. Determine the local folder (line 7) and provide the URL of the Reporting server on line 8 (without "/reports"). For this example the SSRS server is located on a Virtual Machine in Azure.

###################################################################################
# Download Reports and DataSources from a SSRS server and create the same folder
# structure in the local download folder.
###################################################################################
# Parameters
###################################################################################
$downloadFolder = "c:\temp\ssrs\"
$ssrsServer = "http://myssrs.westeurope.cloudapp.azure.com"
###################################################################################
# If you can't use integrated security
#$secpasswd = ConvertTo-SecureString "MyPassword!" -AsPlainText -Force
#$mycreds = New-Object System.Management.Automation.PSCredential ("MyUser", $secpasswd)
#$ssrsProxy = New-WebServiceProxy -Uri "$($ssrsServer)/ReportServer/ReportService2010.asmx?WSDL" -Credential $mycreds

# SSRS Webserver call
$ssrsProxy = New-WebServiceProxy -Uri "$($ssrsServer)/ReportServer/ReportService2010.asmx?WSDL" -UseDefaultCredential

# List everything on the Report Server, recursively, but filter to keep Reports and DataSources
$ssrsItems = $ssrsProxy.ListChildren("/", $true) | Where-Object {$_.TypeName -eq "DataSource" -or $_.TypeName -eq "Report"}

# Loop through reports and data sources
Foreach($ssrsItem in $ssrsItems)
{
    # Determine extension for Reports and DataSources
    if ($ssrsItem.TypeName -eq "Report")
    {
        $extension = ".rdl"
    }
    else
    {
        $extension = ".rds"
    }
    
    # Write path to screen for debug purposes
    Write-Host "Downloading $($ssrsItem.Path)$($extension)";

    # Create download folder if it doesn't exist (concatenate: "c:\temp\ssrs\" and "/SSRSFolder/")
    $downloadFolderSub = $downloadFolder.Trim('\') + $ssrsItem.Path.Replace($ssrsItem.Name,"").Replace("/","\").Trim() 
    New-Item -ItemType Directory -Path $downloadFolderSub -Force > $null

    # Get SSRS file bytes in a variable
    $ssrsFile = New-Object System.Xml.XmlDocument
    [byte[]] $ssrsDefinition = $null
    $ssrsDefinition = $ssrsProxy.GetItemDefinition($ssrsItem.Path)

    # Download the actual bytes
    [System.IO.MemoryStream] $memoryStream = New-Object System.IO.MemoryStream(@(,$ssrsDefinition))
    $ssrsFile.Load($memoryStream)
    $fullDataSourceFileName = $downloadFolderSub + "\" + $ssrsItem.Name +  $extension;
    $ssrsFile.Save($fullDataSourceFileName);
}

There is also code (comment out) to provide a username and password in case you cannot use integrated security. Replace line 16 with the code on lines 11 to 13 and provide the username and password.

2) Result
Running the script in PowerShell ISE downloads all reports and data sources.
Downloading all reports

Summary
This is a 'quick & dirty' script to download all SSRS reports at once. You can adjust the script to you own needs and make it more beautiful. A upload(/deploy) script will be provided in a next blog post.


Friday 31 August 2018

Power Apps Snack: Pass values to other screen

Case
I want to navigate to a new screen and get a value from the calling screen to filter a specific record on that new screen. Most examples (including 'Start from data') filter a record with the selected item from a specific gallery (on a specific screen) with:
BrowseGallery1.Selected
However I want to call this screen from various calling screens (not just one). Is there a push meganism instead of  a pull meganism to filter the record on the new screen?
Navigating to a new screen from various screens


Solution
The solution is to pass a value from the calling screen to the new screen. The Navigate function has an optional argument called 'UpdateContextRecord' which allows you to pass a record to the new screen which on its turn updates the context variable on the new screen. Then you can use that variable to filter a specific record.


1) Calling screen(s)
In PowerApps a record with one column (a variable) looks like:
{myIntColumn:123}

If you put this in the 'UpdateContextRecord' argument from the Navigate function it looks like:
Navigate(myNewScreen, 
         ScreenTransition.None, 
         {myIntValue:123})


The hardcoded '123' should of course be replaced with some code to get the value from a gallery column on the calling screen. The Value function converts the string to a number:
Navigate(myNewScreen,
         ScreenTransition.None,
         {myIntValue:Value(ThisItem.myIntColumn)})

You need to repeat this on all calling screens that want to navigate to this new screen.

2) New screen
On the new screen this record will be pushed to a new context variable which can be used in for example a LookUp function in the Item property of a form:
LookUp('[dbo].[myTable]', myIntColumn=myIntValue)
Changed from pull to push


Alternative form item formula:
First(Filter('[dbo].[myTable]',myIntColumn= myIntValue))
Conclusion
In this post you learned how to pass through variables from one screen to an other. This can be used to pass through values for filters from several screens instead of just reading values from one screen.

Wednesday 29 August 2018

Power Apps: Introduce Power Apps for Power BI

Case
With PowerApps, Microsoft brought a new element to the existing world of reporting and dashboarding inside the Microsoft BI stack. For example, you can connect and customize your data using PowerApps. How does this work and how can you use PowerApps inside Power BI?

Power BI Marketplace - PowerApps custom visual


Solution
Important to know is that Microsoft PowerApps is part of Office 365. In case your organization does not have an Office 365 licence, PowerApps will cost 7 or 40 dollar per user per month. With a license, you can start building your own apps. There are more features available for an additional cost. More details about pricing here.

In this post we want to show you how you can connect to your data and store new data in an Azure SQL Database using PowerApps. For this example, you can give as Sales Employee approval (or not) on the report. This all happens in a Power BI dashboard using PowerApps.

1) Create new PowerApp
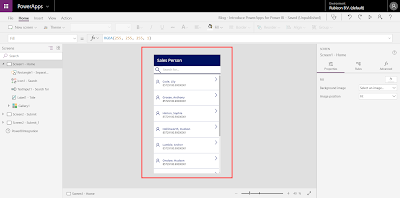
We will build the PowerApp using the Power BI Desktop and service. First, you have to create a new report in Power BI Desktop and add the PowerApps custom visual to the report. Choose PowerApps from the marketplace. Notice that this visual is still in Preview.

Power BI Desktop - Add PowerApps custom visual


For our example, we will use data from WideWorldImportersDW (Azure SQL Database) and import the "Employee" dimension and "Sales" fact table. We have implemented a number of transformations to keep only sales employees and created a 'Employee Full Name' column with values like 'Schuurman, Ricardo'. We choose the columns 'Employee Full Name' and 'Profit' in the PowerApps custom visual.

After you have published your report and opened it in the Power BI service, you will see the option Create new. You will be redirected to the development portal of PowerApps.

Power BI Service - Create new PowerApp using custom visual

Note:
When you create a new PowerApp using the Power BI service, a new dataset for the Power BI data will automatically be created with the name "'PowerBIIntegration'.Data".

2) Build PowerApp
Once you are in the development portal, you can start building your app. In a next post we will fine tune the app and explain and show you several elements of the PowerApp.

PowerApps Studio - Developing the PowerApp


Important to know is that we have created a new table in WideWorldImportersDW, called "SalesApproval".

USE [WideWorldImportersDW]

CREATE TABLE [PowerBI].[SalesApproval](
 [SalesApprovalKey] [int] IDENTITY(1,1) NOT NULL,
 [EmployeeFullName] [nvarchar](100) NULL,
 [Profit] [numeric](20, 8) NULL,
 [Approved] [nvarchar](50) NULL,
 [Comment] [nvarchar](max) NULL,
 CONSTRAINT [PK_Dimension_Employee] PRIMARY KEY CLUSTERED 
(
 [SalesApprovalKey] ASC
)WITH (STATISTICS_NORECOMPUTE = OFF, IGNORE_DUP_KEY = OFF) ON [PRIMARY]
) ON [PRIMARY] TEXTIMAGE_ON [PRIMARY]
GO

In this table we will store the data we have filled with the PowerApp. Later on we will show you how to do this and which data will be stored.

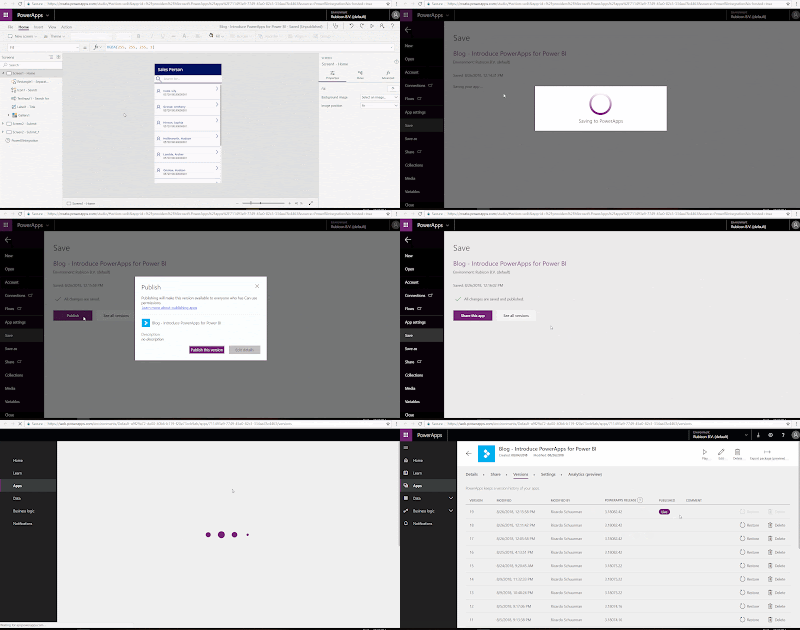
When you are done developing, you have to save and publish the PowerApp. After this, the app is live and available in several applications, such as Power BI and Microsoft Teams.

PowerApps Studio - Publishing the PowerApp


Note:
After saving and publishing your PowerApp it can happen that the PowerApp is missing the Power BI data the next time you open it. To fix this, go to the Power BI service and add a new Power Apps custom visual in the report. Select the right columns (in PowerApps Data) and click on Choose app. Add your existing app and go to the PowerApps Studio. Now your PowerApp is working again, including the Power BI data.

3) Result
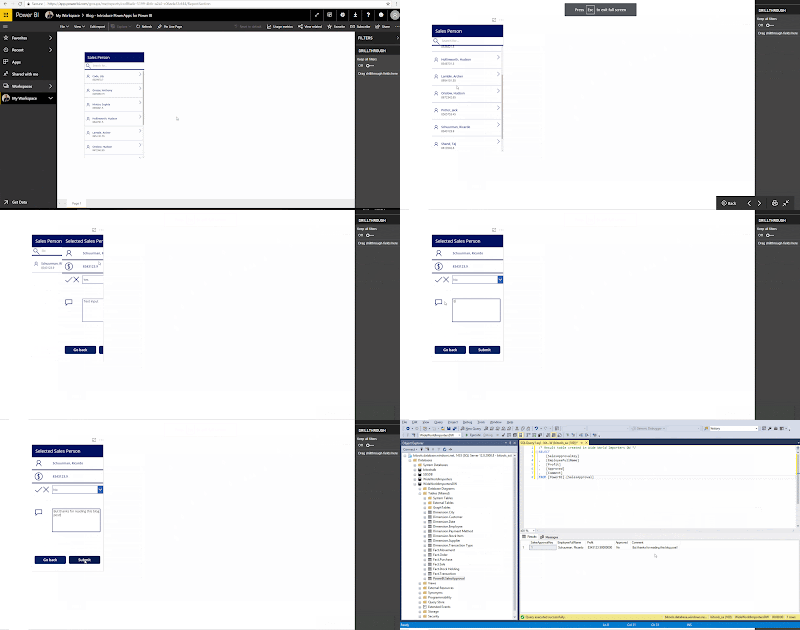
Let's see if we can use this PowerApp in Power BI and store the result in the table "SalesApproval" we created earlier. Go to the Power BI service and open the report. Search for the right sales person (this is you as sales person if this dashboard is live) and fill in the form:
Yes or No for approval and associated comment (Text input). Press Submit when you are done.

Now if we look at the table in SQL Server Management, we see a new record containing the data we have filled in. Cool!

Power BI Service - Submit data in PowerApp (custom visual) and result


You can download the Power BI report here and the first version of the corresponding PowerApp we used for this post here. Use the Export (preview) and Import (preview) feature to add the app in your environment.

Note:
The Export and Import feature is still in preview. After preview, you must have PowerApps Plan 2 trial or PowerApps Plan 2 paid license for this feature.

Summary
In this post you saw how to use the PowerApps custom visual in Power BI. For this example we used PowerApps to approve (or not) a sales report and store this data in an Azure SQL Database.

In a next post we will describe and explain how this PowerApp is build. We will also customize the app to make it more user friendly.

Sunday 8 July 2018

Power Apps Snack: Replace Textbox by Drop down

Case
I generated an app with Microsoft PowerApps, but I want to replace the generated textbox on a foreign key field (integer) with a Drop Down with values from the related table. This would make the form much more usable. How do I accomplish this in PowerApps?
Replace standard textbox


Solution
For this example we have two tables: Job and JobStep. JobStep has a Foreign Key to Job. This is a one to many (1-n) relationship. By default this (foreign key/integer column) will become a textbox when you generate an app on data. We will be replacing it with a Drop Down that stores the JobId, but shows the Job name instead. Below you see the model.
1-n relation with Foreign Key on JobStep.JobId = Job.JobId


1) Add Data source
The app is generated on the JobStep table only. If we want to get a list of Jobs to show, we need to add an extra data source for the Job table. Via the View menu click on Data Sources and then on Add data source. Now you can select the server and then the table.
Add Data source


2) Replace Textbox by Drop Down
The default field type for this integer column (JobId) is a textbox. We will replace this by a Drop Down by taking the following actions.

  • Click on the datacard of JobId (not only the textbox) and then click on Edit in the property pane.
  • Click on the 123 option behind the JobId field and change it from Edit Number to Allowed Values.

Now the Textbox has been changed to a Drow Down box. Next step is to show the names from the Jobs table.
Change textbox to drop down


3) Show name in Drop Down
Now that we have a Drop Down we need to fill it with the Name column from the Job table.
  • Click on the Drop Down box itself
  • Go to the Advanced tab in the property pane on the right and click on 'Unlock to change properties' to override the default settings.
  • Go to the ITEMS property and replace it by the Job table: '[dbo].[Job]'
  • In the VALUE property select the field you want to show: Name in this case.
  • Then enter this expression in the DEFAULT property to retrieve the Name column via the JobId column.: LookUp('[dbo].[Job]', JobId = ThisItem.JobId, Name)
Change Drop Box properties to show the Name column


Explanation Lookup expression:
  • FROM: First part is the table where you want to do the lookup. Where does your data come from? In our case this is the Job table.
  • WHERE: Second part is the WHERE statement, where JobId is the column in lookup table (Job). The part after the equals sign is the lookup value that comes from your app.
  • SELECT: The last part is the column that you want to retrieve. In our example we want to show the Name column from the Job table.

4) Saving the ID

The Drop Down is now showing the Name column, but we want to save the id column JobId.
  • Click on the card again. The easiest is via the Screens pane on the left.
  • Go to the UPDATE property and change it with the following expression to save the JobId field instead of the name field: DataCardValue17.Selected.JobId Warming: the name 'DataCardValue17' of the data card value (the drop down) is probably different in your app.
change Default property


5) Testing
Now press on the play button and edit the form to see the result. If you take a good look, you see the ID changing from 72 to 73 on the details screen.
Testing the form changes


Summary
In this post you learned how to change the standard textbox in a generated app to a very useful Drop Down. This is especially handy when you have a 1-n relationship with not too many records. In a next post we will try to find a solution for an n-n (many to many) relationship.

Now that you are ready with the edit form, you probably also want to change the JobId in the Details screen. You could for example solve this with a lookup on the text property of that label. Change Parent.Default to LookUp('[dbo].[Job]', JobId = Value(Parent.Default), Name).


Perhaps not part of the BI stack itself, but though a very useful supporting tool for BI projects. Thanks to coworker Siebe for helping figuring this out.


Saturday 30 June 2018

Power Apps Snack: Add confirmation to delete button

Case
I generated an app with Microsoft PowerApps, but the delete button is missing a confirmation and deletes records a bit too easy. Is there an option to ask something like "are you sure?".
Need some delete confirmation


Solution
There is no out of the box option, but you could change the delete button action a little bit. In this example we will add two more hidden buttons (Confirm and Cancel). The Delete button will unhide these buttons. The Confirm will then do the actual delete and the Cancel will hide the buttons again.

1) Create variable
The first step is to create a Boolean variable for this screen that will be used to show or hide buttons. In the screens pane on the left side click on the screen with the Delete button. Then add the following expression in the OnVisible property: UpdateContext({isVisible: false}). Now you have a variable called isVisible.
Add screen variable with value 'false'


2) Add Confirmation and Cancel icons
Add two icons to your screen via the Insert ribbon. One for the Confirmation action and one for the delete. Also add a label above it with a text like "Are you sure?".
Add icons and label


3) Move delete code
Now Cut and Paste the OnSelect code from the Delete button to the Confirm button and change the Delete button code to UpdateContext({isVisible: true}). This will change the variable value from false to true.
Switch delete code


Add the following 'reverse' code to the OnSelect of the Cancel button: UpdateContext({isVisible: false}). This will change the variable value back from true to false.

4) Hide buttons and label
Since we don't want to show the icons when you haven't clicked on the delete button, we need to change the Visibily property of the two icons and the label. We will replace the default value 'true' to the isVisible variable.
Change Visibility


The intermediate result is a delete button with a confirmation.
Delete with confirmation


5) Disable other buttons
To finish it off we can disable the other buttons so that the user has to confirm or cancel the delete. To accomplish this we need to adjust an expression in the DisplayMode property of the Delete and Edit button. You need to add: && !isVisible to the if contruction. To make it a little more visable that the buttons are disabled you could change their disabled font color to grey.
Final adjustments


The result


Summary
In this post you learned how to add a confirmation visual to a delete button and learned how to add and use variables to change properties of items on your screen (because you cannot use code like: btnCancel.Visible = true).

The (value of the) variable is only usable on this screen. Other screens cannot use it. In a next post we will show you how to pass values from one screen to another screen.

Note that Microsoft PowerApps isn't part of Azure, but part of Office 365. However this tool could be very useful in Business Intelligence / Data Warehouse projects to replace manually created Excel / CSV source files with for example forecast data or simple lists that don't come from a source system. Users often 'accidentally' damage such files for example by adding or deleting columns. With PowerApps you can prevent that. An other great way to use Power Apps is within Power BI as an input form, but more about that in a next blog.


Monday 4 June 2018

Execute Logic Apps in Azure Data Factory (V2)

Case
In an earlier post, we showed you how to use Azure Logic Apps for extracting email attachments without programming skills. The attachments contain the source files. Because this step is part of an Data Warehouse solution, it would be nice to run this together with the ETL process that needs these source files. How can we archive this?

Azure Data Factory V2 - Execute Azure Logic App


Solution
In the first few years of Azure, it was not possible to run your Data Warehouse process entirely in the Cloud. Of course, you could store the data in Azure SQL Database or Azure SQL Data Warehouse (see here for the differences between these two), but when you are using SQL Server Integration Services (SSIS) you still had to run this on-premise or create a custom Virtual Machine. Until recently. This post explains how you can execute SQL Server Integration Services (SSIS) packages in Azure, using Azure Data Factory (ADF) V2.

Besides running SSIS packages in ADF V2, you can also execute other Azure services in here. For example: Azure Databricks, Azure Data Lake Analytics (U-SQL scripts) and HDInsight (services like Hadoop, Spark, Hive etc.).

This post shows you how to execute an Azure Logic App inside ADF V2.

1) Add and configure activity
Create a new pipeline or edit an existing one. Select "General" and choose the Web activity. Give it a suitable name and go to Settings. Fill in the URL, corresponding to the one inside the HTTP trigger in the Azure Logic App, you created earlier:

Azure Logic App - URL in HTTP Trigger


Select the "POST" API Method. Now add a Header and enter the following:
  • KEY: Content-Type
  • VALUE: application/json
When you are finished, click Publish All.

Azure Data Factory V2 - Configure Web Activity


NOTE:
Nowadays the Body is also mandatory, enter the following: @concat('{','}')

2) Run pipeline
After you have published your pipeline, go to Trigger and select Trigger (Now). You can also run the pipeline without publishing it: using Debug. In this mode you will see the result of the pipeline run in the bottom at Output.

NOTE:
If you do not publish your pipeline, you are getting the following error when you are trying to use Trigger (Now):

Pipeline Error - Use Trigger (now) without publishing


NOTE 2:
If you do not publish your pipeline, you are getting the following warning when you want to access the monitor screen:

Pipeline Warning - Go to Monitor without publishing


3) Result
Once you have triggered the pipeline, go to Monitor on the left in the menu. Default it will open the Pipeline Runs overview, but you can also select the Integration Runtimes or Trigger Runs overview at the top.

You can also watch the Runs history of the Logic App:


View Result - Logic App run history


Summary
This post explains how you can manage other ETL, next to SSIS, in your Data Warehouse using one orchestrator. In this case we execute an Azure Logic App using Azure Data Factory (V2).

Click here to see how you can also execute a SSIS package using Azure Logic Apps.