Showing posts with label POWER_BI. Show all posts

Friday 3 September 2021

Virtual Network Data Gateway for Power BI

Case
My company doesn't allow public end points on my Azure resources like the Azure SQL Database and the Azure Data Lake. Now Power BI cannot use these sources directly and therefore we have to install an On-premises Data Gateway on an Azure Virtual Machine within the same VNET as my sources (or in a peered VNET). Is there an alternative for this VM solution?
Data Gateways and one with a different icon


Solution
Yes there is a promising new alternative for the silly VM solution, but there are some caveats which will be shared in the conclusions. A few months ago Microsoft announced the VNET Data Gateway for cloud sources. Now the service is available for testing. The two main benefits are:
  • No need for a Virtual Machine which you need to maintain (but which you probably forget)
  • No need for the On-Premises Data Gateway which you need to nearly update each month
You will still need a Virtual Network (VNET) to connect this service to other Azure services to allow the connection to Power BI or other services of the Power Platform. Within this VNET we need a subnet that can delegate to the Microsoft Power Platform.


1) Resource Provider Microsoft.PowerPlatform
The first step for adding the VNET gateway is to check within your Azure Subscription whether the Resource Provider Microsoft.PowerPlatform is already registered (probably not). By registering this Provider you will be able to connect the Subnet of Step 2 to the Gateway of step 3.
  • Go to the Azure portal and login as an owner of the Subscription.
  • Go to the Subscription overview page (the same subscription where your VNET is also located)
  • In the left menu you will find the option Resource Providers.
  • Search for Microsoft.PowerPlatform and check the Status column. If is Says NotRegistered then select it and hit the Register button in the top.
Register Resource Provider


2) Add Subnet to VNet
Now that we have the new Resource Provider we can add a Subnet to an existing VNET. The VNET is a simple default 'installation' with an address space of 10.240.134.0/23 (512 addresses 10.240.134.0 to 10.240.135.255). 
  • Go to your existing VNET
  • In the left menu click on Subnets to see the available subnets
  • Click in + Subnet (not + Gateway Subnet) to add a new Subnet
  • Give it a suitable name (gatewaysubnet is reserved/not allowed)
  • Choose a small Subnet address range, 28 will give you 16 ip addresses of which 11 can be used to add gateways. IP6 is now allowed at the moment.
  • The most important property for the VNET gateways is Subnet delegation. Make sure to set it to Microsoft.PowerPlatform/vnetaccesslinks.
Add Subnet to VNET


3) Add VNET Gateway
For the final step, creating the gateway, we need to go to the Power Platform admin center. So this means it not an Azure located service. For this step you need to be add least an Azure Network Contributor (but Subscription Owner will work as well).
  • Log in to the Power Platform admin center
  • In the left menu click on Data (preview)
  • Then go to the tab Virtual Network data gateways to see existing gateways or to add a new one
  • Click on + New to add a new VNET Gateway
  • Select the Azure Subscription of your VNET / subnet. Subscriptions where step 1 was not performed will give an error when you select them: Please register "Microsoft.PowerPlatform" as a resource provider for this subscription to continue creating a virtual network data gateway.
  • Select the Resource Group of your VNET
  • Select the VNET
  • Select the Subnet of step 2
  • Give the new Gateway a suitable new
Add Virtual Network data gateway


You can also add other user to use this new gateway, but at this moment you can only add administrators and you wont see the Can use or the Can use + Share option. Probably because it is still in Public Preview at the moment of writing.
Can use or the Can use + Share are missing


Conclusion
In this post you learned about the new Virtual Network Data Gateway for Power BI. The lack of maintenance is the big benefit for this new service. But there are also a few caveats besides being a Preview service. Some of them will probably be solved when the service will get the status General Available.
  1. This new service only works for Power BI premium workspaces. This is a real big deal since I don't want to make all my workspaces premium.
  2. The price is still unknown. May be it will be a premium feature, but then they have to solve the first issue.
  3. The performance to Azure Data Lake is very slow compared to an On-premises Data Gateway on an Azure VM (up to 6 times slower!). This is a bug where they are working on. However this brings up an other issue. How can you tweak the performance of this new gateway. You cannot create a cluster with multiple gateways and you cannot chance the core/memory.
  4. The number of source is still a bit low. Only Microsoft cloud services are supported (since you cannot install third party drivers). 
  5. On-prem sources are also not supported which would be very useful to reduce the number of servers (and maintenance) in my on-prem network since VNET can also be connected via VPN to the on-prem network. However Microsoft products like SQL Server should work since they use the same drivers as Azure SQL Database (not tested).
  6. Can use & Can use + Share is still missing which only allows gateway admins to use this service.
So altogether a very promising new service from Microsoft. Still a couple of issues, but hopefully they will all be fixed when it will be General Available. The real deal breaker will be issue 1 and solving issue 5 will really boost the success of this new service. For more detailed installation steps read Docs.

Tuesday 31 August 2021

Analyze Azure Data Factory logs - part 3: Power BI

Case
In a previous blog post we showed how to query the logs of Azure Data Factory within Azure Log Analytics, but how can you show that same data in a Power BI report?
Using KQL as source for Power BI


Solution


1) Export KQL query as M query
The previous step of writing that query is the most important step. Make sure you have a query, or better a couple of queries, that represent a dimensional model instead of just a simple table. This will make creating Power BI reports so much easier and faster.
  • Go to the query editor of the Log Analytics workspace
  • Then open an existing query (via Query explorer) or write a new one.
  • Once the query is successful, hit the Export option and choose "Export to Power BI (M query)".
  • This will result in downloading a text file with an M query in it. Analyze the generated M query and optionally adjust it to your own needs
Export to Power BI (M query)


Note that you can also see your KQL query as a parameter for Rest API call and that besides the M query it also contains some explanation for Power BI.

2) Blank Query Power BI
Now the last step is fairly easy. Especially when your queries are already modeled in a dimensional model. If not you will have to do some extra steps
  • Open Power BI desktop and choose Get Data
  • In the Other section at the bottom you will see the Blank Query option
  • Select it and click Connect. A new Power Query Editor window will open
  • Now hit the Advanced Editor option in the Home ribbon.
  • A third Advanced Editor window will open. This is where you copy and paste the content of the downloaded file of step 1 and click on Done.
  • Give the query a name and click on Close & Apply in the Home ribbon.

Repeat this step for all queries that you created for your report and then you can start creating that report! Well, you might need to add some relations between the tables for the best result.
Add the M query to Power BI


Conclusion
In this post we showed you how to use a KQL query in Power BI. Make sure most of the easy transformations are done within KQL. This saves you a lot of time in Power BI. And as mentioned before: make your query like a fact and dimension table. This makes it so much easier to generate the report.

Saturday 21 March 2020

Embed a Power BI tile in Power Apps with filters

Case
I want to include a Power BI tile in my Power App. Is it possible to manipulate the Power BI tile with data from the Power App?
Power BI tile in Power Apps with filter


Solution
Power Apps has its own charts. So why would you want to use a Power BI tile in your Power App in the first place? The charts from Power Apps are pretty fast, but since Power Apps is not a reporting tool the functionality is quite basic. The two major disadvantages are:

  • The charts don't have options in the GUI for sorting, filtering or grouping. So either your Data Source is already prepared or you to do that with functions in Power Apps (Filter, GroupBy, SortByColumns, etc.). Not ideal, especially not for large datasets.
  • The charts are very basic (Column, Line or Pie chart). You could combine a column and line chart by creating two separate charts and then lay the line chart over the column chart. Again workable, but not ideal.


Let's see how you can add a Power BI tile to your Power App and what you have to do to make it more dynamic with filters.

1) Pin visual to dashboard
Power Apps can only add Power BI visuals that are pinned to a dashboard. Go to your Power BI report on PowerBI.com and click on the little pin icon above the Visual that you need in Power Apps. After that specify to which existing or new Power BI Dashboard you want to publish it.
Pin your visual to a dashboard


2) Add Visual to Power Apps
In the Insert menu of Power Apps you see the Charts submenu in which you will find the option to add a Power BI tile. Adding it is very straight forward. Just select the right Workspace, Dashboard and then the Tile.
Adding a Power BI tile to Power Apps


3) Adding dynamic filters
If you go to the properties of the new Power BI tile in Power Apps you will find the TileUri property. This is the URL of your Power BI tile which you can extend with filters. The standard URL looks something like:
"https://app.powerbi.com/embed?dashboardId=11111111-aaaa-1234-aaaa-111111111111&tileId=11111111-aaaa-1234-aaaa-111111111111&groupId=11111111-aaaa-1234-aaaa-111111111111&config=abc123abc123abc123abc123abc123abc123abc123abc123abc123abc123abc123abc123abc123abc123abc1230%3d"
The DATA TileUri


You can simply add a filter to this URL by adding an extra parameter to the querystring. Let's say we have a field called Department in the table FactInternetSales and we want to filter on the value 'Amsterdam'.
The field on which we want to filter


Before the last double quote of the TileUri you must add &filter=[tablename]/[columnname] eq '[value]'. The result looks like:

"https://app.powerbi.com/embed?dashboardId=11111111-aaaa-1234-aaaa-111111111111&tileId=11111111-aaaa-1234-aaaa-111111111111&groupId=11111111-aaaa-1234-aaaa-111111111111&config=abc123abc123abc123abc123abc123abc123abc123abc123abc123abc123abc123abc123abc123abc123abc1230%3d&filter=FactInternetSales/Department eq 'Amsterdam'"

Note that filter is in lowercase otherwise it won't work. For more OData like filter examples see the documentation of Power BI filters. A great tip is to first test the query string filter in Power BI itself and then copy and paste it to Power Apps. After that you can replace the hard-coded value 'Amsterdam' by a value from for example a drop drown.
Adding a Drop Down to use it in the filter


With the drop down the URL looks like:

"https://app.powerbi.com/embed?dashboardId=11111111-aaaa-1234-aaaa-111111111111&tileId=11111111-aaaa-1234-aaaa-111111111111&groupId=11111111-aaaa-1234-aaaa-111111111111&config=abc123abc123abc123abc123abc123abc123abc123abc123abc123abc123abc123abc123abc123abc123abc1230%3d&filter=FactInternetSales/Department eq '" & ddDepartment.Selected.Department & "'"
If your table name or field name contains spaces, dashes or non-ansi characters you need to replace those with special characters in your query string.

4) The result
Now you can hit the play button and test the dynamic filter. It works very well, but it isn't super fast. Therefore you shouldn't have more than three Power BI tiles loaded at the same time. With the property LoadPowerBIContent you can control which tile is loading.

When clicking on the Power BI tile in your Power App the user will be redirected to Power BI online to do some more in-depth analysis. If you don't want that you need to set the PowerBIInteractions property to false (default is true).
Testing the dynamic filter


Conclusion
In this post you learned how to use Power BI tiles, that are published to a dashboard, in Power Apps. Very straight forward to use and they have way more options than the built-in charts. One last point for attention. If you use these Power BI tiles then make sure that your Power Apps users have a Power BI licence and are authorized to the used tiles.

Monday 21 October 2019

Flow Snack: Refresh Power BI

Case
Exiting news from the Microsoft Power Platform. You can now use Microsoft Flow to refresh a Power BI dataset. How does it work and why would you want to use it?
Refresh a Power BI dataset


Solution
Until now you could schedule your refresh or do a manual refresh in Power BI, but now you can also use Flow to trigger a refresh when new data arrives. For example when a new source file arrives in OneDrive, DropBox, SharePoint or a Azure Blob Storage Container. But the list of triggers in Flow is nearly endless and the number of possible sources in Power BI is growing steadily so most likely one of these sources fits your needs.


1) Choose your trigger
First choose a trigger to refresh your dataset. In this example the trigger is 'When a blob is added or modified' in the Azure Blob Storage container.
Trigger when new data arrives in a Blob Storage container


2) Search for Power BI
Add a new action and search for Power BI and select Refresh a dataset. Note that it is still a Preview version and could change.
Refresh a Power BI dataset


3) Choose Workspace and Dataset
Now you must select your workspace and then the dataset in that workspace. After that save your Flow and check whether it is turned on and then start testing it by adding new files.
Select Workspace and Dataset that needs to be refreshed


Summary
An exiting new feature where you can use all kinds of triggers to refresh your Power BI dataset. Note that the refresh limitations still applies. So for PRO you have a maximum number of 8 refreshes a day and that is including any scheduled refreshes.


Friday 29 March 2019

Azure - Reuse Power BI dataflows

Case
Microsoft recently introduced Power BI dataflows for self-service ETL or data preparation. It uses an Azure Data Lake Storage (ADLS), which is only visible to Power BI, to store the metadata and result of the dataflows. However, you can also bring your own storage account. How does that work and why would you want that?

Bring Your Own Storage in preview

Solution
As we mentioned earlier in our previous post, Power BI dataflows can be seen as a self-service data preparation tool. It is easy accessible, so that other people in your organization (besides IT) can get started with transforming and maintaining the data. Nowadays there are often several people / business analysts in a department who are maintaining Excel files. With Power BI dataflows you can centralize this process and contribute to the ideology of "one version of the truth".

When you bring your own ADLS Gen2 storage account (StorageV2) for Power BI dataflows, other services like Azure Data Factory or Azure Databricks could use that same data. This makes it possible to do light weight data preparations with an user-friendly tool for corporate data warehousing or data science. However Power BI dataflows does not (yet?) replace SSIS, Azure Data Factory or any other ETL tool. They could even write back data to the data lake to create 'external' dataflows that are not maintained in Power BI.

Configure and connect to your own storage account
First you have to create an ADLS Gen2 storage account. Make sure the storage account is on the same region as the Power BI tenant. Click here for the documentation of Microsoft that explains step by step how to create such account.

Next, execute the following steps to make a connection with your own storage account. Note that the last step is a one-time action that cannot be changed afterwards.

It requires the following permissions to make a connection:
  • Role "Owner" in the Azure Subscription (service administrator / classic administrator) to add an ADLS Gen2 storage account. This is also required to give the Power BI Service access to the storage account and Blob Container. 
  • Global Administrator in O365 or Azure Active Directory to connect your ADLS Gen2 storage account with dataflows. This has to be done in the Power BI admin portal. The role Power BI Service Administrator is not sufficient to perform those actions.

Power BI Service - Successfully connected to your own ADLS Gen2 storage account


Result
To actual store the dataflow definition and the related data files in your ADLS Gen2 storage account, you must create a new Power BI app workspace or update an existing one. In case of an update, make sure you do not already have dataflows stored in the workspace. Otherwise you cannot change this.

In this case we created a new workspace. Turn on Dataflow storage (preview) under "Advanced" settings. In this case we built the same (simple) dataflow as our previous post. Save your dataflow and click "Refresh".

Azure Storage Explorer
When the dataflow is refreshed, go to the Blob container you created earlier for your ADLS Gen2 storage account. Here you will find the definition (source code) of the dataflow and the output. Note that the content of the ADLS Gen2 storage account is only visible in Azure Storage Explorer. Click here to download.

Azure Data Explorer - Result in own ADLS Gen2 storage account


And now you can choose per workspace whether you want to use this new Data Lake. This only works for the new workspaces, that are at the moment also still in preview.
Power BI Workspace settings


Common errors
When you try to connect to your own storage account in the admin portal of the Power BI Service, you can get several errors.

You must have global administrator permissions
Only Global Administrators in Office 365 or Azure Active Directory are administrators in Power BI and therefore able to connect to the storage account. Click here for more information about administrator roles in Power BI.


There was a problem accessing your dataflow storage account
After creating your storage account , it can take up to 30 minutes to make a connection. Also make sure you avoid spelling mistakes.

Your storage account must be in the same Azure Active Directory tenant
This occurs for example when you are trying to make a connection with the ADLS storage account in the Power BI Service with an account outside the organization. In this case, the organization (subscription) is where the storage account is created.


Conclusion
In this post we showed you how to use your own Azure Data Lake Storage account instead of the default provided by Power BI using dataflows. This new feature has several possible use cases. For example:
  1. Data preparation for 'corporate' data warehousing by a business user with a user-friendly tool
  2. Data preparation for 'corporate' data science by a business user with a user-friendly tool
  3. Creating 'external' dataflows for Power BI with Azure Services like Data Factory or Databricks
  4. Using data from other CDM-compliant applications like Dynamics 365 and Office 365

We hope Microsoft will make it a bit easier to bring your own storage, because at the moment there are a lot of steps to take and you need a lot of rights to do it. This discourages to arrange this powerful option.

We also expect some more admin capabilities in Power BI, because at this moment you cannot change your dataflow storage once Power BI is connected to your own ADLS account (so be very careful). And for larger corporations one ADLS account is probably not enough. It is also expected that the integration and collaboration with other Azure services will be improved so that you are even more flexible in choosing the services in your BI landscape.

Saturday 23 March 2019

Power Apps Snack: Refresh Power BI (automatically)

Case
A while ago we blogged about the integration of PowerApps and Power BI. This allows you to change data from within your Power BI report! One downside was that you still had to refresh the Power BI data manually (or by using the API and Flow). How can you automate the refresh?
The new PowerApps Visualization in Power BI


Solution
Microsoft recently updated PowerApps with the ability to refresh Power BI. Now you can add the refresh command PowerBIIntegration.Refresh() right after your SubmitForm or Patch command. That is all!
PowerBIIntegration.Refresh()


Note: For me it didn't work for existing PowerApps. I had to create a new PowerApp to get the refresh option available. We will follow up on that.
Update 25-03-2019: The Refresh() function gets added to PowerApps from the visual on creation. Therefore it will not be available for existing PowerApps. The workaround for now is creating a new app and then copy and paste the items from the existing app. Please upvote this uservoice request.

Refresh without clicking on the Refresh button in Power BI


Summary
Finally we have an even better integration of PowerApps and Power BI. No more clicking on refresh buttons. Also note the new PowerApps Visualization in Power BI. It got a total makeover with some handy explanations about the integration of both tools. See the top picture. Also see this link for more PowerApps updates

Monday 31 December 2018

Power BI - Introducing dataflows

Case
Power BI recently introduced dataflows. What is it and who should use it?
Power BI dataflows


Solution
According to Microsoft this new addition is for self-service ETL by business annalists and BI professionals. A minor addition from our side: especially business annalists that are skilled with tools like Excel and BI professionals with already a focus on Power BI will probably be very exiting using this new addition. An other group that could benefit of this new feature is the technical application administrator that has a great amount of knowledge of the data model of their application. With dataflows the could do some data preparation for the business annalists

First of all you must have at least a Power BI Pro license and this new preview feature is a Power BI Service-only feature that is not (yet?) available in Power BI Desktop. However you can use the result of a Data Flow which we will show you in the last step.

1) Power BI Service
To create a dataflow, sign in to Power BI Service and go to one of your workspaces, but not My Workspace. Or create a new workspace. Here you will find a new tab called "Dataflows (preview)" and in the Create-menu there is a dataflow option. Click on it to create a new dataflow.

Power BI dataflows - Create new dataflow


2) Add new entities
In this step we will add a source for our dataflow. You can map this data to one of the standard Common Data Model (CDM) entities, but you can also create 'custom' entities that are not mapped. The CDM is a standard model for example for contacts or accounts to which you can map your sources like CRM or SalesForce. It should make it easier for development, but also analytics. In a subsequent post we will explain the CDM.

For this example we will not map to CDM, but create a 'custom' entity. We will use a text file that contains sensor data. We use Azure Blob Storage to store this data, but of course you can also use an internal file share. However then you first need to install the On-premises data gateway.


As told, we choose "Azure Blobs" as data source and next fill in the connection settings. If you have ever used this storage account before then it will remember the account key. Choose your Blob folder which contains the data and now you can transform your data similar to the Power Query Editor in Power BI Desktop.
Power BI dataflows - Create new Entity


3) Edit Query
Just like Power BI Desktop you can do data preparation inside an "Edit Query" mode. This Power Query version does not have the full functionality compared to Power BI Desktop, but the expectation is that it will be extended in the upcoming releases. Some limitations of the current Query Editor in dataflows are: you cannot change the datatypes of the columns or use the 'Group By' function.

Power BI dataflows - Power Query Editor


There are also differences between a Pro license and Premium. In case you are doing some basic transformations like combining two queries (using Merge or Append queries) it will cause the following warning when using a Pro license:
This dataflow contains computed entities, which require Premium to refresh. To enable refresh, upgrade this workspace to Premium capacity.

Power BI dataflows - Pro license vs Premium


More information about the differences between a Pro license and Premium here.

4) Save and use dataflow 
After finishing the data preparation, you must save the new dataflow. Give it a suitable name and after saving, you will be asked to refresh the dataflow or schedule it later. You can set up a "Scheduled refresh" the same way as a dataset.

Power BI dataflow - Save (and schedule refresh)


Open Power BI Desktop, select "Get Data" and now you can use a Dataflow as a source for your report.

Power BI Desktop - Use a dataflow as source


Conclusion
In this post we created our first dataflow, a new (preview) feature of Power BI. Despite we are using the first version which is still lacking of some basic features, it already looks very promising. We expect/hope that the limited Power Query possibilities will soon be aligned with those in Power BI Desktop making this a very powerful tool.

The main benefit of this new addition, is that you don’t have to setup and host a separate ETL tool with possibly complex code. Now everything is integrated in one platform. The disadvantages are, besides the limited Power Query options, the lack of versioning and release management.

Will it replace enterprise ETL with tools like SSIS, Azure Data Factory and Azure Databricks? Probably not in the near future. For now it is still self-service ETL which you could use as a first step to enterprise ETL. However, Microsoft will likely extend this tool in the coming years. Just like they did with Power BI itself. Back in 2014 most people didn’t see that as a serious alternative for reporting.

An alternative route map could be integrating Power BI dataflows within your existing BI platform. You can publish (and refresh) the result of your dataflows to Azure Data Lake and then pick up the data, besides Power BI, with tools as Azure Databricks and Azure Data Factory. We will explain this in a subsequent post next year.

Wednesday 31 October 2018

Power BI Snack: Introducing Data Profiling

Case
When data is not extracted from a cleaned up or validated environment, such as a Data Warehouse or Data Mart, the first step is to analyse and possible clean up the data. How can Power BI help in this?

Data Profiling in Power Query Editor


Solution
The release of October 2018 Desktop update introduced a new (preview) feature that can profiling the data in the Power Query Editor. With this, you can do some quick analysis over your data and you can easily identify errors and empty values in a column.

For this blog post we use sample data from WideWorldImporters. We have saved the data in a CSV file, because it is more common to do this kind of analyses when you load raw data from Text or CSV files into your Power BI Model instead of using validated data from a star schema in a Data Mart.

Apply data profiling in Power BI
Because it is a preview feature, we have to turn this feature on. Go to "File - Options and settings - Options - Preview features" and select Enable column profiling.

Power BI Desktop - Enable Preview feature


Open the Power Query Editor and load your data. In our case it is a CSV file that contains raw data about sales orders. Go to the "View" tab and select Column quality. With this option you can see whether your data contains errors or empty values, also known as "null" values.

Power BI Desktop - Column quality in Power Query Editor


Besides this, you can also view the total of unique and distinct values. Go to the "View" tab and select Column distribution. Unique values indicates how many values occur only once and distinct values means how many different values there are in the specific column. Now the Query Editor will also recommend to do a quick fix if you want, for example remove the duplicate values in a column.

Power BI Desktop - Column distribution in Power Query Editor


Note:
Be aware of the fact that column profiling is only based on top 1000 rows (preview results of the query).

Conclusion
In this post you saw a new feature called "Data Profiling". It is a good start and useful to use this for doing some quick analyses over your data. Note that this feature is in preview.

The program team of Power BI has announced to add more capabilities for data profiling, so we are very curious about what this will bring even more in the future.

Wednesday 29 August 2018

Power Apps: Introduce Power Apps for Power BI

Case
With PowerApps, Microsoft brought a new element to the existing world of reporting and dashboarding inside the Microsoft BI stack. For example, you can connect and customize your data using PowerApps. How does this work and how can you use PowerApps inside Power BI?

Power BI Marketplace - PowerApps custom visual


Solution
Important to know is that Microsoft PowerApps is part of Office 365. In case your organization does not have an Office 365 licence, PowerApps will cost 7 or 40 dollar per user per month. With a license, you can start building your own apps. There are more features available for an additional cost. More details about pricing here.

In this post we want to show you how you can connect to your data and store new data in an Azure SQL Database using PowerApps. For this example, you can give as Sales Employee approval (or not) on the report. This all happens in a Power BI dashboard using PowerApps.

1) Create new PowerApp
We will build the PowerApp using the Power BI Desktop and service. First, you have to create a new report in Power BI Desktop and add the PowerApps custom visual to the report. Choose PowerApps from the marketplace. Notice that this visual is still in Preview.

Power BI Desktop - Add PowerApps custom visual


For our example, we will use data from WideWorldImportersDW (Azure SQL Database) and import the "Employee" dimension and "Sales" fact table. We have implemented a number of transformations to keep only sales employees and created a 'Employee Full Name' column with values like 'Schuurman, Ricardo'. We choose the columns 'Employee Full Name' and 'Profit' in the PowerApps custom visual.

After you have published your report and opened it in the Power BI service, you will see the option Create new. You will be redirected to the development portal of PowerApps.

Power BI Service - Create new PowerApp using custom visual

Note:
When you create a new PowerApp using the Power BI service, a new dataset for the Power BI data will automatically be created with the name "'PowerBIIntegration'.Data".

2) Build PowerApp
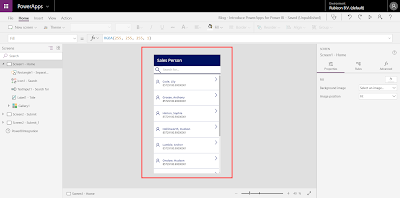
Once you are in the development portal, you can start building your app. In a next post we will fine tune the app and explain and show you several elements of the PowerApp.

PowerApps Studio - Developing the PowerApp


Important to know is that we have created a new table in WideWorldImportersDW, called "SalesApproval".

USE [WideWorldImportersDW]

CREATE TABLE [PowerBI].[SalesApproval](
 [SalesApprovalKey] [int] IDENTITY(1,1) NOT NULL,
 [EmployeeFullName] [nvarchar](100) NULL,
 [Profit] [numeric](20, 8) NULL,
 [Approved] [nvarchar](50) NULL,
 [Comment] [nvarchar](max) NULL,
 CONSTRAINT [PK_Dimension_Employee] PRIMARY KEY CLUSTERED 
(
 [SalesApprovalKey] ASC
)WITH (STATISTICS_NORECOMPUTE = OFF, IGNORE_DUP_KEY = OFF) ON [PRIMARY]
) ON [PRIMARY] TEXTIMAGE_ON [PRIMARY]
GO

In this table we will store the data we have filled with the PowerApp. Later on we will show you how to do this and which data will be stored.

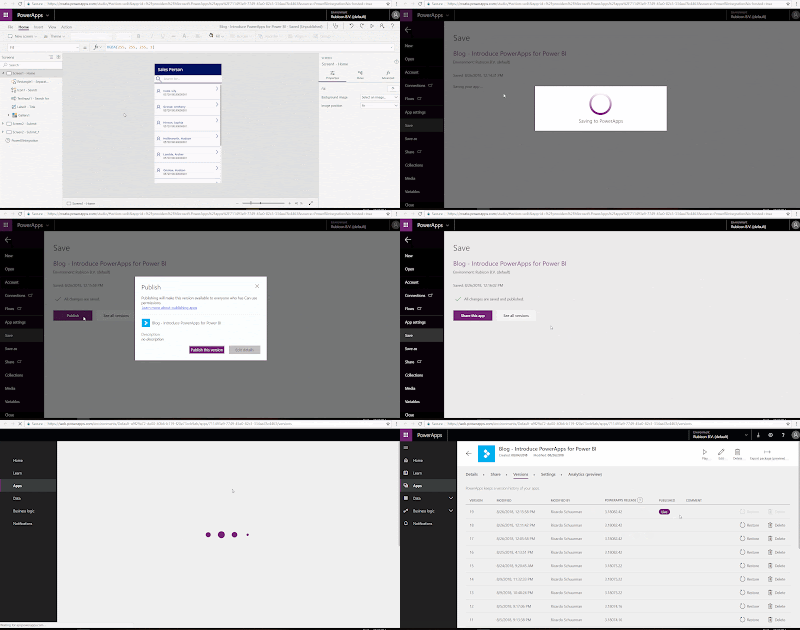
When you are done developing, you have to save and publish the PowerApp. After this, the app is live and available in several applications, such as Power BI and Microsoft Teams.

PowerApps Studio - Publishing the PowerApp


Note:
After saving and publishing your PowerApp it can happen that the PowerApp is missing the Power BI data the next time you open it. To fix this, go to the Power BI service and add a new Power Apps custom visual in the report. Select the right columns (in PowerApps Data) and click on Choose app. Add your existing app and go to the PowerApps Studio. Now your PowerApp is working again, including the Power BI data.

3) Result
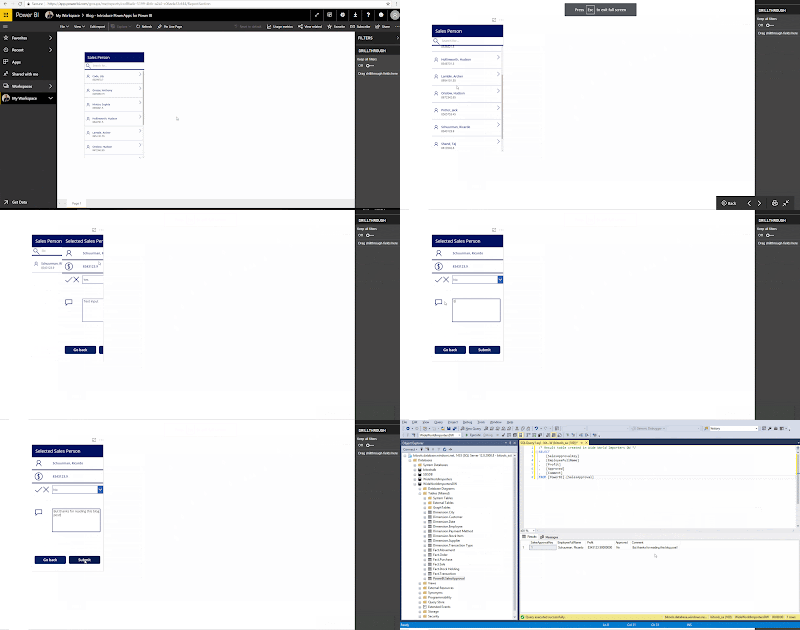
Let's see if we can use this PowerApp in Power BI and store the result in the table "SalesApproval" we created earlier. Go to the Power BI service and open the report. Search for the right sales person (this is you as sales person if this dashboard is live) and fill in the form:
Yes or No for approval and associated comment (Text input). Press Submit when you are done.

Now if we look at the table in SQL Server Management, we see a new record containing the data we have filled in. Cool!

Power BI Service - Submit data in PowerApp (custom visual) and result


You can download the Power BI report here and the first version of the corresponding PowerApp we used for this post here. Use the Export (preview) and Import (preview) feature to add the app in your environment.

Note:
The Export and Import feature is still in preview. After preview, you must have PowerApps Plan 2 trial or PowerApps Plan 2 paid license for this feature.

Summary
In this post you saw how to use the PowerApps custom visual in Power BI. For this example we used PowerApps to approve (or not) a sales report and store this data in an Azure SQL Database.

In a next post we will describe and explain how this PowerApp is build. We will also customize the app to make it more user friendly.

Thursday 25 January 2018

Power BI - Bookmarking feature update (December 2017)

Case
In an earlier post we explained and showed you how to use the new bookmarking feature (October 2017 update) through an example combining a chart and related information of this chart. Besides that, you can also use bookmarks to switch between two charts in the same area in your report page. Unfortunately, this had its limitations: passing filters and multiple toggles. What has changed in the bookmarking functionality that makes it more user-friendly to use?

Bookmark updates December 2017


Old situation
Shortly after the release in October, we implemented bookmarks at our customer. We used two different charts in the same area in a report page to let our users look at the data from two perspectives, without making a new page or report. This is one of the great benefits of using bookmarking.

Unfortunately we quickly realize that this is a nice added functionality, but still has its limitations. In this post we will show you two examples: the passing of selected filters to another bookmark and multiple toggle buttons in one page.

Example 1: passing of selected filters
The selected filter in one bookmark doesn't work on the other bookmark when you switch from chart. If you select year 2016 in the first bookmark (with the first chart) and clicking on the button for the other bookmark (the second chart), the second chart will show all the data instead of only 2016.

Old - Filters not applying other bookmarks


Example 2: multiple toggle buttons
Multiple buttons in one report page to switch between charts doesn't work. When you have two toggle buttons (left and right area) where you want to switch charts: clicking toggle button number two on the right also effects the button (and the chart) on the left.

Old - Multiple toggle buttons doesn't work


Solution
As mentioned before, there are some updates related to the bookmark feature. These will solve the two examples in the old situation we described earlier. With this update, they also give you the ability to create a bookmark with a cross-highlighting state of your report. Before, cross-highlighting was not included as part of a bookmark and you could only save the entire state of a report (without selected filters, selected bar in a chart etc.). Now everything that is in your report can be saved as a part of a bookmark.

For now we will focus on solving the problems in the two examples described earlier about filtering and multiple toggle buttons in one report page.

Create the Report (images)
First, make sure you have the latest Power BI Desktop version. If you are using Power BI Desktop from the Microsoft Store, it updates automatically. Otherwise you can download the latest version of Power BI Desktop here.

The starting point in both reports is the same report from an earlier post. In example 1 we created a new chart on the same spot in the left corner of the chart 'Total Sales and Profit per Month'. We added a toggle button above the chart where you can switch between those two charts. In example 2 on a new report page we also added a new chart on in the right upper corner of the chart 'Total Sales and Profit per State'. We also use a toggle button here. Now we have have two toggle buttons on the same report page.

We created the toggle buttons by our own using Google images and then customized them with Paint.NET. For the text before the buttons, we used the custom visual 'Long Text Viewer'. You can download it here (it is not available in the store).

Result example 1
With this update you now have three categories of types of stuff to save in a bookmark: data (slicers, filters, cross-highlighting etc.), display (hiding visual, spotlight etc.) and current page (which page is related to the bookmark). You can turn these categories on and off by the settings of a bookmark.

New - Turn items on and off


To fix the problem from example 1, you have to uncheck the data category for both bookmarks (charts) which are involved with the toggle button. Now it only effects the buttons and the charts.

New - Selected filters effects other bookmark


Result example 2
Besides those new three categories, there is another option available: Selected Visuals (default is All Visuals). You will find this option below the categories.

New - Selected visuals

To fix the problem from example 2, we use this Selected Visuals. As said before, by default it will bookmark the entire page, but now you can select the visuals (charts, buttons etc.) that you want to include in the bookmark. First, we select all the visuals related to the left toggle button (black and off). You need to repeat this for the left toggle button, but now for all the visuals when this button is on (grey). Repeat this for the toggle button on the right and by the end there are four bookmarks. Do not forget to configure 'Link' in each bookmark for making both buttons work. Finally, select Selected Visuals for all those four bookmarks. To be clear: it seems simple, but it is meticulous work!

Below you will find the making of this solution.


NOTE:
By creating a bookmark with Selected Visuals, note the following:
  • Make sure you do not have a bookmark selected when creating a new one. Otherwise it will overwrite this bookmark with the new selected visuals. You can only deselect the bookmark by making an image visible/hidden.
  • After creating the bookmark with selected visuals, you cannot see which visuals are related to this bookmark. They are no longer marked in gray. 
  • You cannot give the visuals a name. In case of multiple toggle buttons you have at least four times a visual called 'image'. By place them in order you can distinguish them.  
You can download the entire Power BI report with all the examples here.

Conclusion
In this post you saw how the new updates related to the bookmark feature gives you more flexibility to creating bookmarks. Not all the technical changes are difficult (check or uncheck), but this is a huge update that will eliminates uncertainties and confusion among our users.

Unfortunately, there are still some updates needed to make it more user friendly to build/maintain the bookmarks. For example the opportunity to give the visuals a name or show which visuals are related to a bookmark (in case of selected visuals).

If you want more information about creating bookmarks in the first place (the basic), click here.