CaseIn a previous blog post about
analyzing ADF logs in Azure Log Analytics we mentioned Kusto Query Language (KQL) as the language used for the standard dashboards, but also for the export to Power BI. How does KQL work and how does it compare to TSQL?
 |
| T-SQL vs KQL |
Solution
In this episode of the series of ADF - Azure Log Analytics we will show you the very basics of KQL and try to compare it to T-SQL for all us DWH and BI developers. After you understand the basics you can for example edit the Microsoft ADF dashboard (template) in Log Analytics to see the more advanced queries that Microsoft used.
Before you start reading make sure you
installed Azure Data Factory Analytics like explained in the first blog post. Without that you can not query on ADF. For these query examples we are using the following three ADF log tables: ADFActivityRun, ADFPipelineRun, ADFTriggerRun. Note that the T-SQL queries are not working and are only used to explain how the KQL queries work.
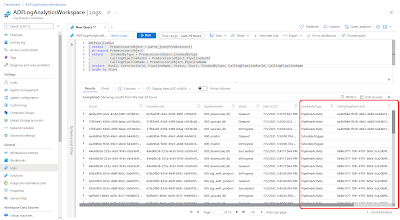
1) Go to the KQL query editor
To start writing your first KQL query we need to go to the editor in Log Analytics.
- Go to your Log Analytics Worspace via the Azure portal
- Click on logs in the left menu
- Close the query 'welcome window'
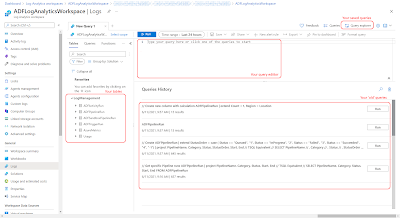 |
| Query editor |
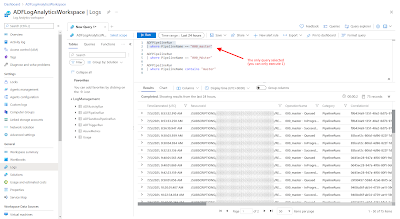
On the left side of the query editor you see the available tables which you can query. On the bottom right you see the queries that you have executed before. Above the Query history your see the actual query editor. After you have written your first query you can hit the save button to store it. With the Query explorer you can find all your saved queries.
2) SelectThe select all columns from a table in KQL is done by only mentioning the table name. In the query result it will show most columns, but not all. Which columns are shown in the result varies per table.
// Get all Pipeline runs
ADFPipelineRun

// TSQL Equivalent
SELECT * FROM ADFPipelineRun
However you can use the Columns button in the result to (un)select certain (un)wanted columns, but note that this is for the current execution only!
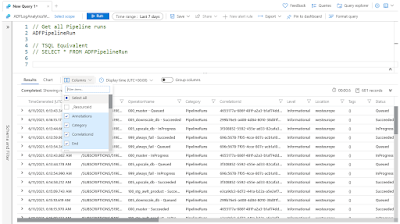 |
| Select 'all' columns in KQL |
If you want specific columns in a specific order then we need to use the | project option. Start the next line in the query editor with a pipeline and the word project, followed by a comma separated columnlist:
// Get specific Pipeline runs
ADFPipelineRun
| project PipelineName, Category, Status, Start, End

// TSQL Equivalent
SELECT PipelineName, Category, Status, Start, End FROM ADFPipelineRun
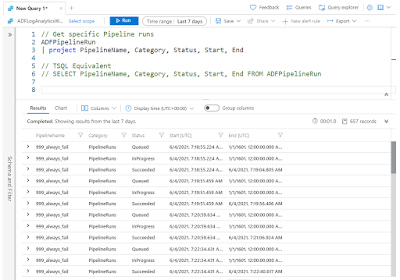 |
| SELECT specific columns in KQL |
3) Where
The WHERE clause in KQL is done by using the | where option quite similar to T-SQL. Note that by default a where is case-sensitive.
// WHERE case-sensitive
ADFPipelineRun
| where PipelineName == "000_Master"

// TSQL Equivalent
SELECT * FROM ADFPipelineRun WHERE PipelineName = '000_Master'
To make the query case-insenitive you can replace the second = (equals sign) by a ~ (tilde sign).
// WHERE case-insensitive
ADFPipelineRun
| where PipelineName =~ "000_MASTER"
A
like in the where clause can be done with a
contains. No need for adding wildcards via %. Furthermore there are a lot more useful
string oparations available in the documentation.
// WHERE like
ADFPipelineRun
| where PipelineName contains "Master"

// TSQL Equivalent
SELECT * FROM ADFPipelineRun WHERE PipelineName like '%Master%'
 |
| WHERE is KQL |
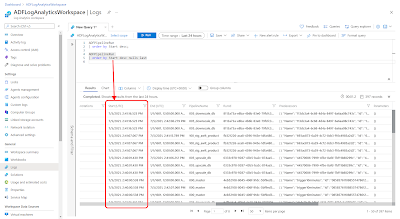
4) Order by
The ORDER BY clause in KQL is done by using the | order by option again quite similar to T-SQL. You can use the same asc and desc option as in T-SQL.
// ORDER BY
ADFPipelineRun
| order by Start desc

// TSQL Equivalent
SELECT * FROM ADFPipelineRun ORDER BY PipelineName desc
KQL seems to be a bit easier with the placement of the
order by in the query. You can also first order and then filter, but lets try to keep the same order as T-SQL. An other neat addition of order by is to use of 'nulls first' or 'nulls last' to handle null values.
// ORDER BY
ADFPipelineRun
| order by Start desc nulls last
 |
| ORDER BY in KQL |
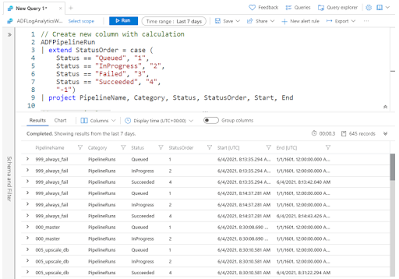
5) Calculated Columns
To create calculations or just simple aliases we need to use the | extend option. In this first example we are using a case statement to add a status order based on the status column. If you are using project then don't forget to add this new column to the project line.
// Create extra column
ADFPipelineRun
| extend StatusOrder = case (
    Status == "Queued", "1",
    Status == "InProgress", "2",
    Status == "Failed", "3",
    Status == "Succeeded", "4",
    "-1")
| project PipelineName, Category, Status, StatusOrder, Start, End

// TSQL Equivalent (you can also use an alias with AS behind the END instead of in front of the CASE)
SELECT PipelineName
,      Category
,      Status
,      StatusOrder =  CASE Status
         WHEN 'Queued' THEN 1
         WHEN 'InProgress' THEN 2
         WHEN 'Failed' THEN 3
         WHEN 'Succeeded' THEN 4
         ELSE -1
       END
,      Start
,      End
FROM   ADFPipelineRun
 |
| Create new column with CASE statement |
You can also use this to create an alias (=copy) for a column and if you have multiple extends then put a comma between each extend.
// Multiple extends and adding 'alias'
ADFPipelineRun
| extend Count = 1, Region = Location
6) Group by
The GROUP BY clause in KQL is done by using the
| summarize by option also quite similar to T-SQL, but everything is done on a single line. The
summarize operator has a lot of options compared to T-SQL.
// GROUP BY
ADFActivityRun
| summarize sum(ActivityIterationCount) by PipelineName

// TSQL Equivalent
SELECT sum(ActivityIterationCount)
FROM   ADFActivityRun
GROUP BY PipelineName
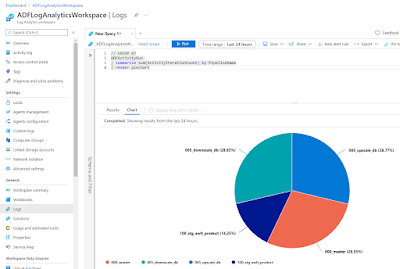
And if you don't want a boring table then you can always add the
| render option to for example add a beautiful
piechart.
// GROUP BY
ADFActivityRun
| summarize sum(ActivityIterationCount) by PipelineName
| render piechart
 |
| Rendering visuals with KQL |
7) Expand JSON fieldsYou will notice that there are a few JSON columns in the ADF tables. In T-SQL you can use
OPENJSON to extract data from those JSON columns, but KQL has an easier solution.
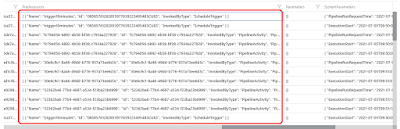 |
| JSON columns |
It uses the extend and mv-expand option. It's a 'three-stage rocket', but very easy for simple JSON structures. The best feature is that it doesn't throw errors when the JSON of a particular record doesn't contain an expected JSON field. It just shows a null value.
// Extract JSON data
ADFPipelineRun
| extend    PredecessorsObject = parse_json(Predecessors)
| mv-expand PredecessorsObject
| extend    InvokedByType = PredecessorsObject.InvokedByType
,           CallingPipelineRunId = PredecessorsObject.PipelineRunId
,           CallingPipelineName = PredecessorsObject.PipelineName
| project  RunId, CorrelationId, PipelineName, Status, Start, InvokedByType, CallingPipelineRunId,CallingPipelineName
| order by Start
- The first extend row in the query parses the JSON column to a JSON object with the parse_json(json) operator (or alias todynamics).
- The row below that with the mv_expand operator is expanding all columns in the JSON object.
- The next row with an other extend allows you to create new columns based on the columns in the expanded JSON object.
 |
| Extracting JSON message in KQL |
ConclusionIn this post you, as an experience T-SQL writer, learned the very basics of the Kusto Query Language (KQL) to extract information from the Azure Data Factory log data. It will probably take a little while getting used the format of KQL queries but after that you will notice that is has some very useful options to extract information from the log data.
In a follow up post we will use this knowledge to write a couple of KQL queries and
export them to Power BI to create a report on your ADF log data. Of course making a dimensional model with those queries makes it much easier and faster to create some fancy reports.


